
Why counting beats describing
"They're bad" is the most common answer to "how are the hot flashes?", and it is almost useless — not because it is untrue, but because it cannot be compared to anything. Bad relative to last month? To before you started treatment? To the week you had a chest infection?
Hot flashes and night sweats — clinically, vasomotor symptoms — are the most-studied symptoms of the menopause transition, and the standard way to measure them in research is a daily diary of episode frequency and severity. That is the unit of measurement the entire evidence base is built on. When you bring the same unit into an appointment, you are speaking the language your clinician's training already uses.
It also protects you from recall compression. Asked to summarise six weeks, almost everybody describes the worst recent stretch. If the previous month was better, that improvement disappears — and so does the evidence that something is working.
The three fields that carry the signal
1. Frequency — a number, not an impression
Count episodes per 24 hours. If counting each one is impractical, count in bands and keep the bands fixed: for example 0, 1–3, 4–6, 7–10, more than 10. Bands are fine. Bands that change definition halfway through are not.
Count daytime flashes and night sweats separately. They respond differently, they wreck different parts of your life, and a combined total hides which one is actually driving the problem. Someone with two mild daytime flashes and four soaking night sweats has a sleep problem; someone with the reverse has a working-life problem. The same total number describes both.
2. Severity — one fixed scale, held for months
Research diaries typically use a three- or four-point severity scale. A workable version, close to what trials use:
- Mild — a sensation of heat with no sweating; you notice it, you carry on.
- Moderate — heat with sweating; you have to do something about it, such as removing a layer or stepping outside.
- Severe — heat with sweating that stops what you are doing; you change clothes, leave the room, or cannot continue the conversation.
Write your definitions down once and reuse them. The specific wording matters far less than the consistency. Most treatment studies report the frequency of moderate-to-severe episodes specifically, because mild flashes are both common and much less disruptive — so if you record severity, you can produce the number that maps onto published evidence.
3. Timing — where in the 24 hours
Time of day is the field most diaries drop, and it is often the most clinically interesting. Clustering matters. Episodes concentrated in the two hours before you take a dose look different from episodes spread evenly, which look different again from episodes concentrated between 2am and 4am. None of those observations is a diagnosis, and none of them tells you what to change — but they are precisely the kind of pattern worth putting in front of someone who can interpret it.
You do not need exact timestamps. Morning / afternoon / evening / overnight is enough to reveal clustering.
Two context fields worth adding
What you took, and when
Log the dose alongside the symptoms, in the same record. A symptom diary and a separate medication list have to be manually cross-referenced by whoever reads them, and usually are not. Missed or late doses are information, not failure — a regimen that is not being taken as intended produces the same symptom picture as one that is not working, and only the log can tell those apart.
The obvious confounders
Alcohol, hot drinks, spicy food, a warm room, and stressful events are commonly reported triggers. You do not need to log everything you eat. Noting the handful of days with an obvious candidate is enough to stop a bad week being misread as a trend, which is the actual purpose of the field.
The real problem: month three
Almost every hot flash diary dies the same way. It starts detailed — timestamps, triggers, long free-text notes — runs for ten to fourteen days, and then stops. What reaches the appointment is two rich weeks from four months ago, which cannot show a trend.
A sparse record kept for six months beats a rich record kept for two weeks, every time. So make the daily entry small enough that you will still do it on a bad day:
- Cap it at about fifteen seconds. If the entry needs a paragraph, it will not happen indefinitely.
- Attach it to something you already do — brushing your teeth, the evening kettle. A fixed cue survives far better than an intention.
- Log once a day, not once per episode. An evening count of the day is more sustainable than real-time entries and, over months, more complete.
- Never leave a gap blank if you can help it. "Zero" and "did not record" mean completely different things to whoever reads the log. A recorded zero is a data point; a hole is noise.
- Keep the fields identical. Adding a field in month two makes the first month uncomparable.
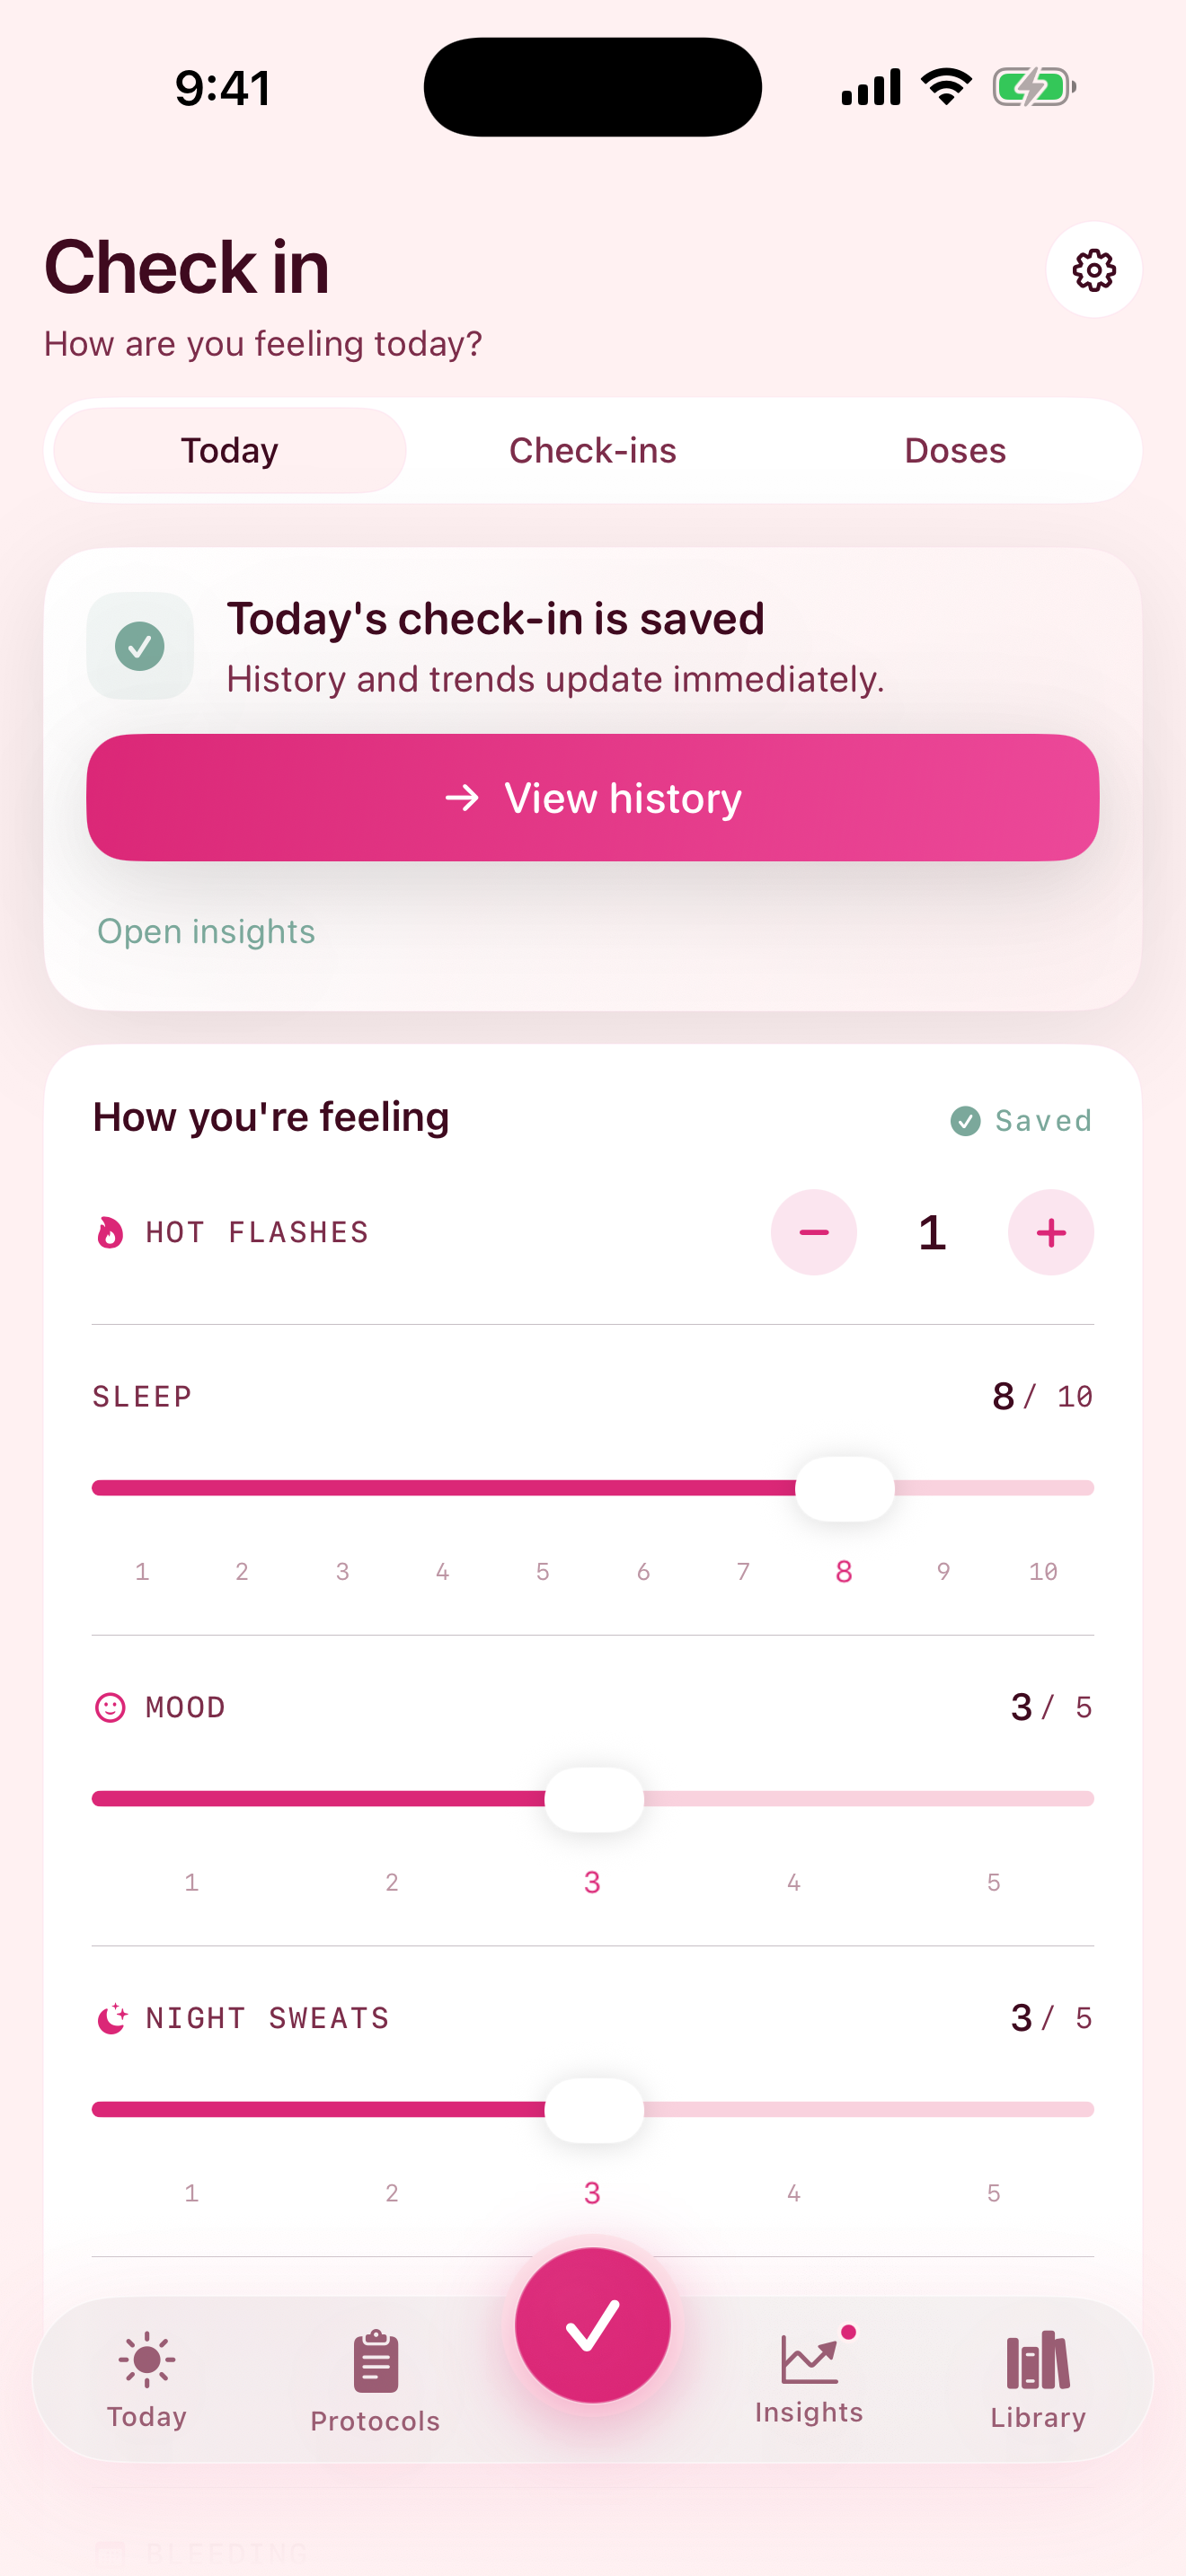
This is the entire reason the HRT AI check-in is built the way it is. Hot flashes, night sweats, sleep, mood, brain fog, anxiety, joint ache, breast tenderness, vaginal dryness, libido, energy and bleeding pattern are one tap each, and the card closes as soon as you save — because the failure mode of symptom tracking is not imprecision, it is abandonment.
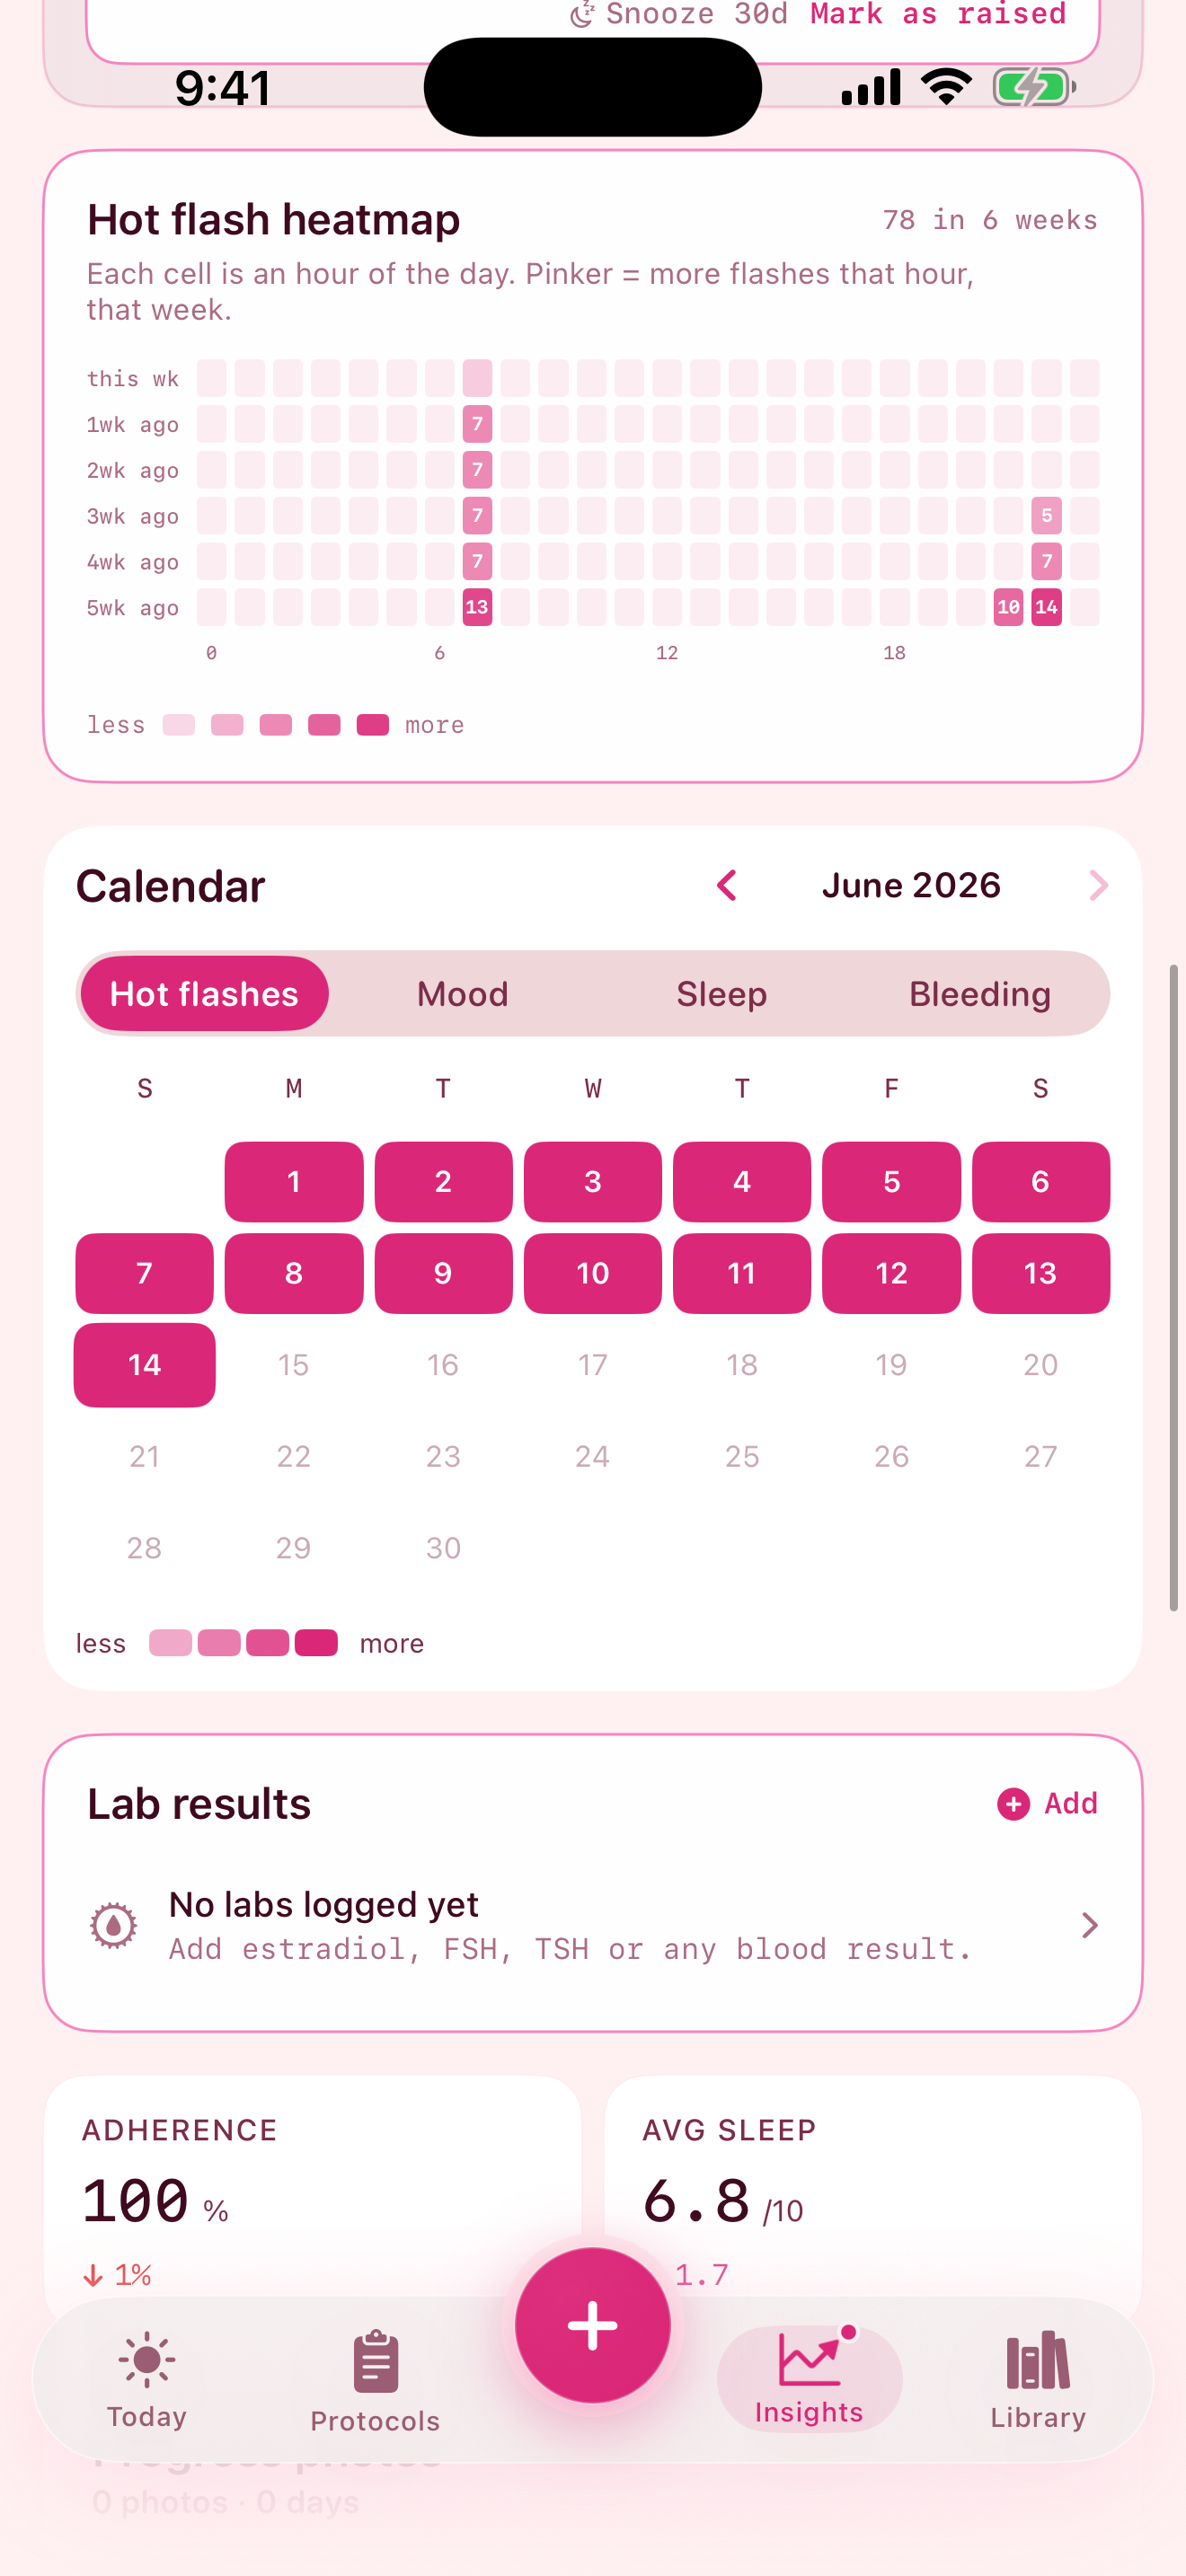
Two details of how it handles flashes specifically. Episodes are logged one at a time with a timestamp rather than as an end-of-day total: a single tap records an episode, a long press adds mild, moderate or severe. Anything logged between 22:00 and 06:00 is classified as a night sweat automatically, so the daytime/overnight split happens without you thinking about it. Because each episode carries a time, the app can then draw a six-week by twenty-four-hour heatmap — which is how time-of-day clustering becomes something you can see rather than something you suspect.
The severity scales are deliberately short. Symptoms are rated 1 to 5, flash intensity 1 to 3. Fine-grained scales feel more precise and are less consistent, because the difference between a 6 and a 7 is not stable across months — which is the property that actually matters in a longitudinal record.
What to bring to the appointment
Do not hand over ninety raw daily entries. Nobody reads them, and the useful content drowns. Bring a summary that answers four questions:
| Question | What to bring |
|---|---|
| How many, now? | Average daytime episodes and night sweats per day over the last two weeks. |
| How bad? | Roughly what share were moderate or severe, using your fixed definitions. |
| Which direction? | The same two numbers from a month or three months ago, for comparison. |
| Anything else changed? | Dose changes, missed doses, new symptoms, and their dates. |
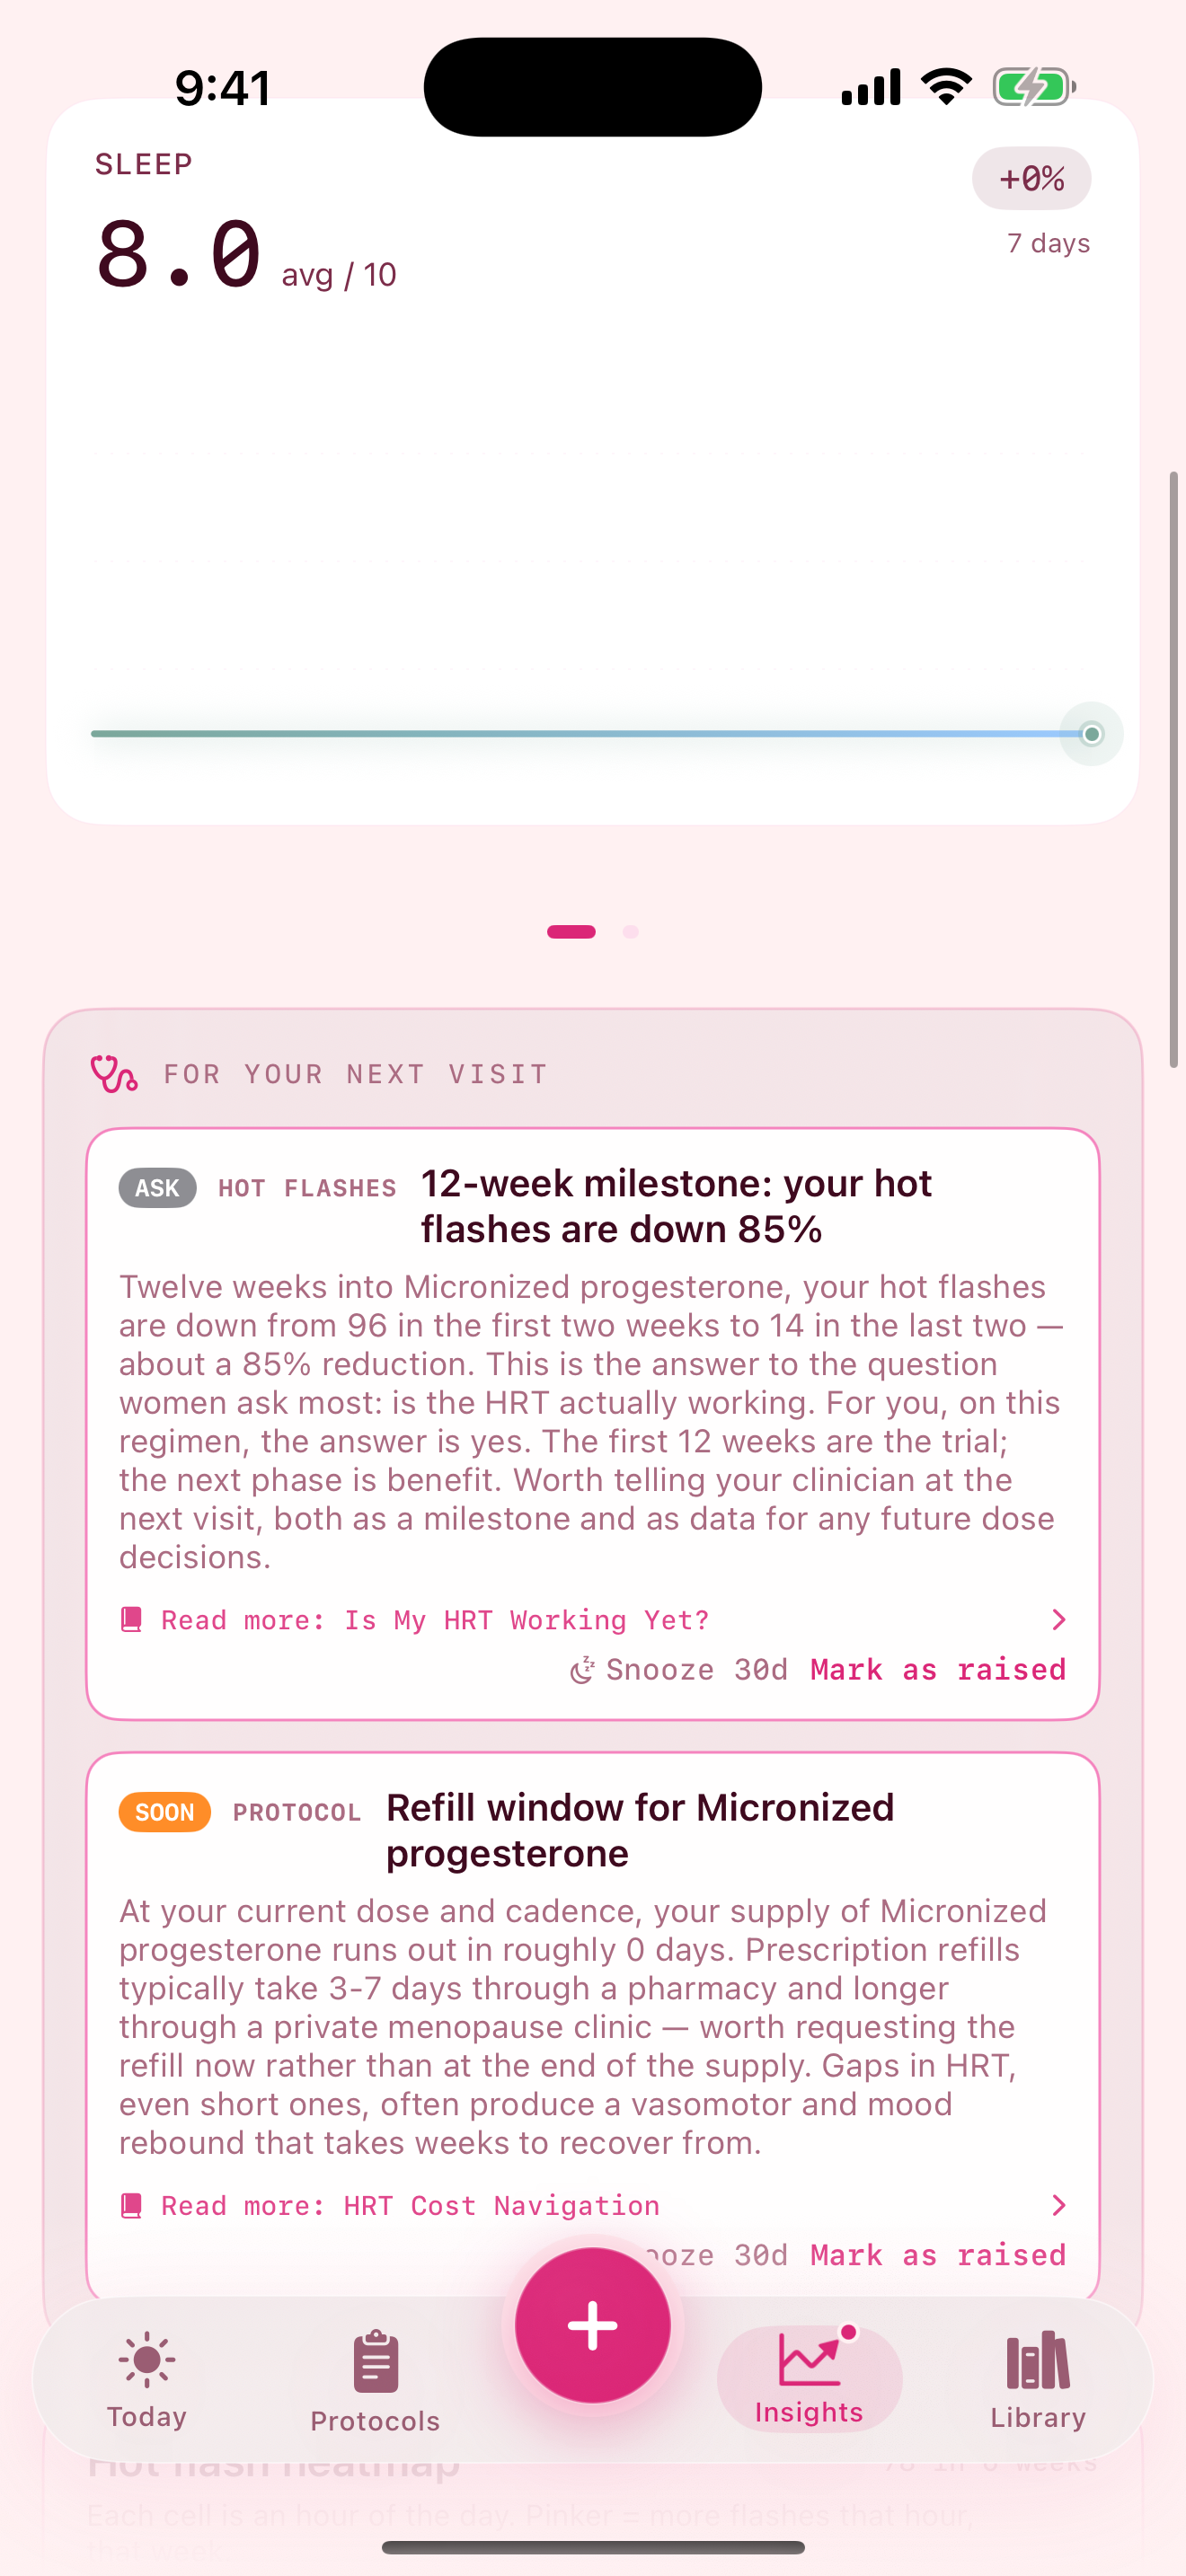
Four numbers and a date beats four pages. If you want the longer record available in case you are asked, bring it as a second document rather than the opening one. HRT AI produces this shape automatically — a one-page clinician report with the last twelve weeks of hot-flash trend and symptom averages, ninety days of bleeding, recent labs, recent dose changes, and the questions you flagged for the visit — but a hand-written index card carrying the same four answers works just as well.
For the rest of the appointment preparation, see what to bring to a menopause appointment.
What a hot flash log cannot do
It cannot tell you whether to start, stop, or change hormone therapy. It cannot tell you a dose. It cannot distinguish menopausal vasomotor symptoms from the other causes of flushing and sweating — thyroid disease, some infections, some medications, and other conditions can all produce similar sensations, which is one reason a clinician takes a history rather than reading a chart in isolation.
What it can do is remove guesswork from the one input only you can supply. That is a genuinely large contribution, and it is the whole job.